Blog
Somewhere between a
diary and a dissertation
I write to get clarity, tell the truth, and pass along what I've learned. Because knowledge is power — but only when it's shared.
Featured blog posts


A tribute to my first boss: David Baker
David taught me how to think like a marketer and carry myself with confidence. I'll never take the investment he made in me for granted.
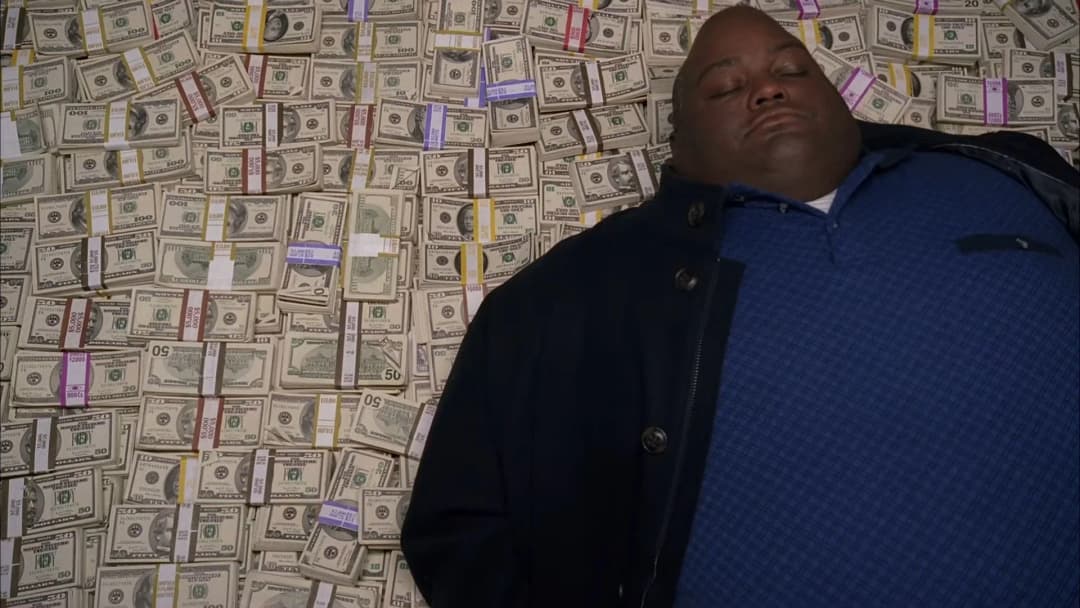
How to build wealth in your 30s
I turn 30 this year. Here's how I think about building wealth over the next decade.
Latest blog posts

2025 Year In Review
Here's my annual recap for the year. Delegation, product thinking, trusting other people, and trusting the process started to compound in visible ways.

A tribute to my first boss: David Baker
David taught me how to think like a marketer and carry myself with confidence. I'll never take the investment he made in me for granted.
How to build wealth in your 30s
I turn 30 this year. Here's how I think about building wealth over the next decade.
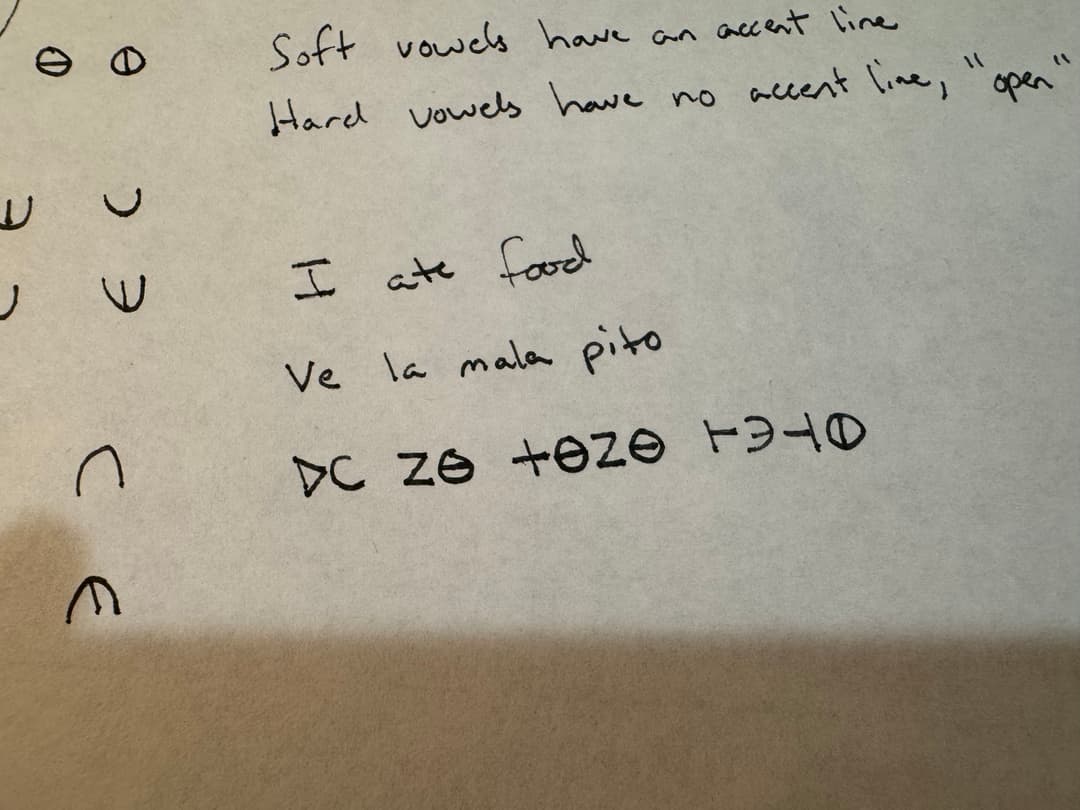
How to make your own language
Learn how to create your own language from scratch with easy, step-by-step guidance based on how I created my own language. Define sounds, alphabets, grammar, pronouns, and how to build intuitive vocabulary.
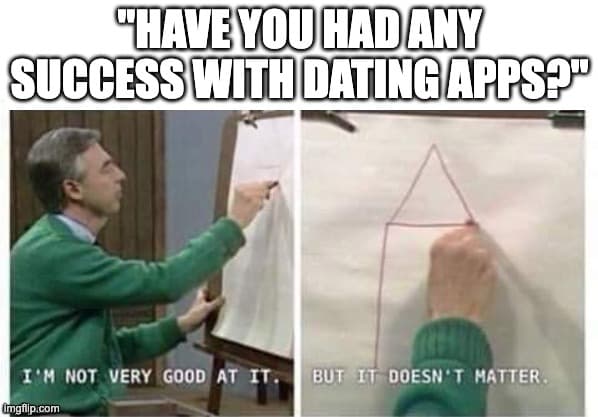
Christian dating advice: Tips to pursue a Godly relationship
When it comes to dating advice, especially for men, there’s an overwhelming amount of information out there — and much of it isn’t helpful.
Get it in writing
When I was a 21 year old optimistic and green aspiring marketer, I had my first salary negotiation, which taught me a valuable lesson about double-checking what's promised.
2024 Year In Review
Here's my annual recap of the year. It's mostly a personal reflection, but also an interesting insight into the life that I live. It was a year of new chapters — both personally and professionally.

2023 Year In Review
Here's my annual recap of the year. It's mostly a personal reflection, but also an interesting insight into the life that I live. 2023 was a year of extreme highs and lows. I already affectionately refer to it as my quarter-life crisis.
Choose your hard
Life isn’t about avoiding challenges, it’s about choosing which challenges are worth facing.
Technology makes you rich
Would you trade places with a billionaire born in the 1700s? Think about what you’d be giving up.
Hard sparring, easy fight
A metaphor for life.

Christians who curse
Does the Bible explicitly tell us that using curse/swear words is a sin? No.
Personal finance for high earners not rich yet (HENRYs)
Most budgeting advice out there is written for people who need to make every dollar count. That’s not you.
How to plan a trip with friends
I recently did a three-week trip with friends who had two kids under the age of two across four countries and six different cities.

What a $1,000 blood test tells you about your health
And how I increased my testosterone by 45% in 9 months completely naturally.
Coding with Cursor AI
It’s astonishing how much more useful AI is when it’s quite literally in your codebase and knows your code better than you do.

How to not use your computer like a boomer
A list of useful shortcuts, hacks, and tools to fly around your computer. From native Mac tools and Chrome extensions to keyboard shortcuts and text replacement.

Astronomers vs Astronauts
Today, everyone can be an “expert” in something. That’s because we don’t have good vocabulary to describe someone who developed expertise via firsthand or secondhand experience.

You’re gonna be somewhere in 10 years
You might as well be...

Creative deals
It’s hard to be creative with legal agreements and financing terms. But these unique deals are oftentimes the most rewarding. The problem is… where do you learn to make creative deals?
How to get a job in marketing
People hiring marketers today want to see that you can actually market something. They want to see the proof. The receipts. Thankfully, it’s never been easier to demonstrate your marketing abilities without a job.

The animal based diet: One year later
The animal-based diet consists of high-quality meat, organs, fruit, honey, raw dairy, and eggs.
My hair transplant experience (before & after)
Unless you’re blessed with superior genetics, every guy at some in their life starts to see their hairline recede.

Productivity tips are mostly unproductive
Your productivity system won’t make you productive. A lack of productivity is usually a lack of conviction. And discipline is born out of conviction.

What inbox zero misses
Your inbox is either at 0 unreads or 1,000+ unreads. The inbox zero fanatics will tout how much better they feel and more productive they are with a clean, organized inbox. But they fail on two counts

How to start a startup
It's easy. All you have to do is... build a product people want, find customers, and avoid running out of money.

Use it or lose it
Use it or lose it applies to everything in life — mobility, strength, cognition, spirituality, relationships.
Ideas I was right about
There are lots of good ideas that you might pass on. And I think it’s valuable to reflect on how other people pursue these ideas.
How to Handle Divorce as a Christian (My Story)
There's a lot of stigma involved in getting divorced as a Christian. I’ll share my story, what I learned from it, and my advice.

How I learned to code in two weeks
In August I flew across the country to spend two weeks in a house with eight strangers from the internet with one goal: learn to code. Here's my review of Founder/Hacker Camp and what I learned.

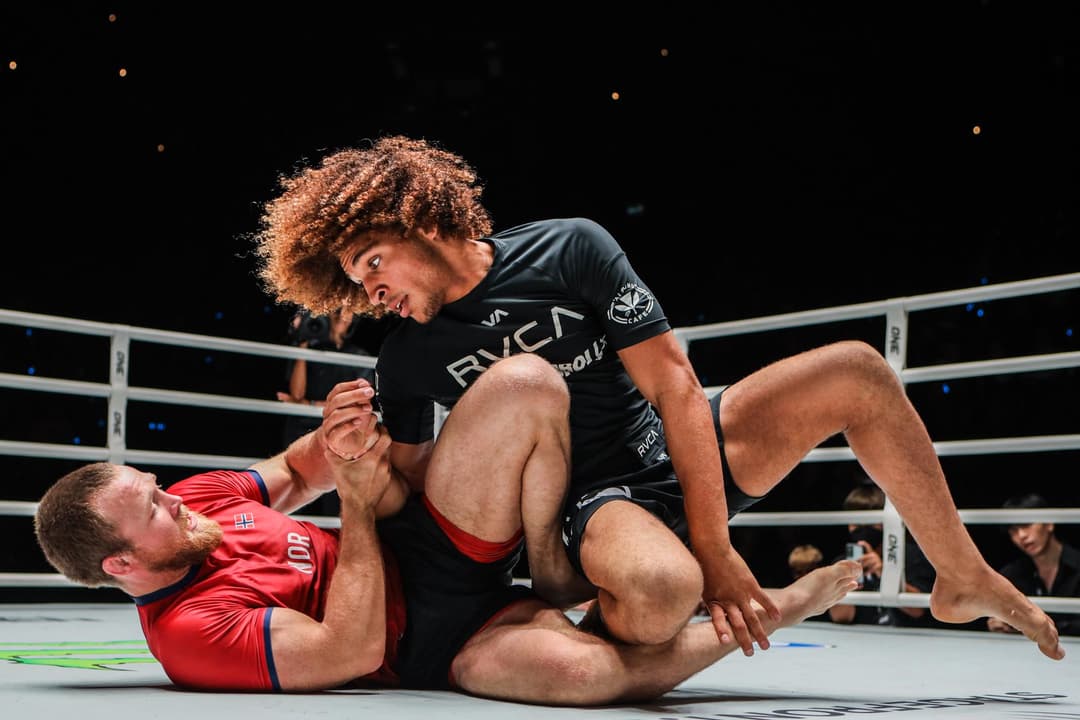
Brazilian Jiu Jitsu 101: The 80/20 of what you need to know and why *everyone* should learn to grapple
What makes jiu jitsu so unique is that it's the only combat sport where you get try as hard as you can without really worrying about injuring yourself or someone else. Here's everything I've learned so far.

Men's Fashion 101: A simple guide for guys tired of looking like a dork
What if I told you that it's actually pretty easy to dress well as a man no matter what your age, ethnicity, or income bracket was? Here's everything I've learned to help you feel good in what you wear and develop your own sense of style, while being grounded in simple principles.

2022 Year In Review
Here's my annual recap of the year. It's mostly a personal reflection, but also an interesting insight into the life that I live. 2022 was a year of doubling down on what works and building momentum. Both personally and professionally, I experimented a lot and found clarity on what to invest in.

San Diego Travel Guide (From A Local)
I found myself sending really long Twitter DMs so if you’re coming to San Diego and want some recommendations from a local, here’s a TLDR version.

2021 Year In Review
Here's a quick recap of my experience with 2021. It's not comprehensive by any means, but gives you a glimpse into my life along with being an effective reflection tool for myself.

User Manual: Corey Haines
I hope this guide helps you understand what makes me tick, explains all the unconsciously annoying things I do, and how to make the most of our time and interactions together.

How To Play Poker (And Beat Your Friends)
I believe everyone should learn how to play poker. It’s a unique game that involves luck, skill, and psychology. Unlike other card games, poker isn’t just about the cards. It’s also about the actions you take to fold, check, bet, call, or raise as well as the actions of your opponents.

My Bucket List
Creating a bucket list is sort of a morbid practice if you think about it hard enough. “Which things do I want to do before I kick the bucket and call it a day on this planet?”

SaaS Funding 101
There are more investors ready to give you money for your startup than ever. What was once scarce is now abundant. Who you take funding from and why is the real issue at hand.

Manifest Destiny
In an attempt to manifest my destiny, I’m going to be pretty transparent on some things I’d like to see happen in my life. By manifest, I mean to leverage the serendipity of the internet to let people know my intentions and also to take a leap of faith myself to be vulnerable and on the hook for my intentions.

2020 Year In Review
Here's a quick recap of my experience with 2020. It's not comprehensive by any means, but gives you a glimpse into my life along with being an effective reflection tool for myself.

Making The Leap
I'm taking the first step towards realizing my entrepreneurial dreams by working on them full time now.

#HYPERGROWTH18: The Cheat Sheet
This last week I flew to Boston to attend my first marketing conference, HYPERGROWTH. Needless to say, it was outstanding. Seriously, the speakers and people I met were far better than even expected.

Write For Your Heroes
Last week I was sending out a business-as-usual tweet the day before my curated newsletter goes out when something unexpected happened:

SaaS Conferences
Events continue to be, and always will be, an essential way to meet, connect with, and learn from people smarter than you. Nothing beats meeting and talking to someone in person.

SaaS Marketing Books
Here's a list of every book I've read (or is on my list to read and has been recommended by others) that's helped me in my journey learning SaaS marketing.

SaaS Marketing Podcasts
I have a borderline unhealthy obsession with podcasts. I can't get enough.

SaaS Marketing Tools
Here’s a curated list of my favorite technology, tools, and services for SaaS marketing.

The Best Blogs, Newsletters, And People To Follow To Become A Better SaaS Marketer
I'm always curious what other people read and who they follow, so I figured I'd share my list for anyone who's interested in what I pay attention to!

What I Learned Reading 4 Books In 9 Days
This past week I went on vacation to Hawaii with family. I also wanted to try an experiment: how many books could I read in one week? To be fair, I started reading two days before I went on vacation, hence 9 days instead of 7.